Logging in Kubernetes with Loki and the PLG Stack
Loki is a new log aggregation system from Grafana Labs. It is designed to be cost-effective and easy to operate. In this article, you learn more about Loki and how to use the PLG Stack (Promtail, Loki, Grafana) for logging in Kubernetes.

Kentaro Wakayama
16 November 2020
What is Loki?
Loki is an open-source, multi-tenant log aggregation system. It can be used with Grafana and Promtrail to collect and access logs, similar to the ELK/EFK stack. While one can use Kibana and Elasticsearch to make advanced data analysis and visualizations, the Loki-based logging stack focuses on being light-weight and easy to operate.
Loki provides a query language called LogQL, which allows users to query logs. It is inspired by Prometheus’ PromQL and can be considered to be a distributed “grep” that aggregates log sources.
One of the main differences to conventional logging systems is that Loki indexes just the metadata rather than the logs’ whole contents. Therefore, the index becomes smaller, which reduces memory consumption and ultimately lowers costs. One drawback of this design is that queries might be less performant than having everything indexed and loaded in memory.
Logs are stored directly in cloud storage such as Amazon S3 or GCS without the need of having to store files on-disk. This simplifies operations and avoids issues such as running out of disk space.
8 Benefits of using Loki
Here are some of the key benefits of using Loki in your stack:
- Easy to use: It's simple to setup and easy to operate.
- Light-weight: It only indexes metadata instead of the full log messages like EFK is doing. This results in less expensive RAM instances required for Loki deployments.
- Cloud-native: It works well together with other cloud-native tools such as Kubernetes, were metadata such as Pod labels are automatically scraped and indexed.
- Uses Object storage: It uses object storage like Amazon S3 or GCS, which is usually cheaper than using block storage.
- Scales horizontally: It can run as a single binary locally or for small scale operations and can easily be scaled horizontally for large scale operations.
- Quorum consistency: It uses Dynamo-style quorum consistency for read and write operations to guarantee uniform query results.
- Multi-tenancy support: It supports multi-tenancy through a tenant ID so that the tenant's data is stored separately.
- Native Grafana support: It has native support in Grafana (needs Grafana v6.0).
Loki's Use Cases
Now that we've talked about Loki's benefits, let's also look at some popular use cases:
Debugging and troubleshooting: Loki helps DevOps teams get to the bottom of problems faster by providing helpful information related to the issue at hand. For example, it is easy to see when a problem arose, what exactly happened, and how the issue came about.
Monitoring: Prometheus is widely used in the industry for monitoring. However, you can identify many issues by monitoring your logs with Loki. For example, you can use it to keep an eye on your website's error rates and receive an alert whenever a certain threshold is exceeded.
Cybersecurity: Loki allows you to identify threats, problems, and malicious activity in your company's systems. What's more, it helps you understand an attack's details after systems have already been compromised.
Compliance: When regulations require companies to keep audit logs, Loki is a reliable and secure option to do so.
Business Intelligence: Loki helps non-technical teams understand log data and develop new strategies and ideas for business growth. For example, marketers can use the data for conversion rate optimization: they can see where customers are coming from, which marketing channels are working best, and which channels need to be improved.
The PLG Stack (Promtail, Loki and Grafana)
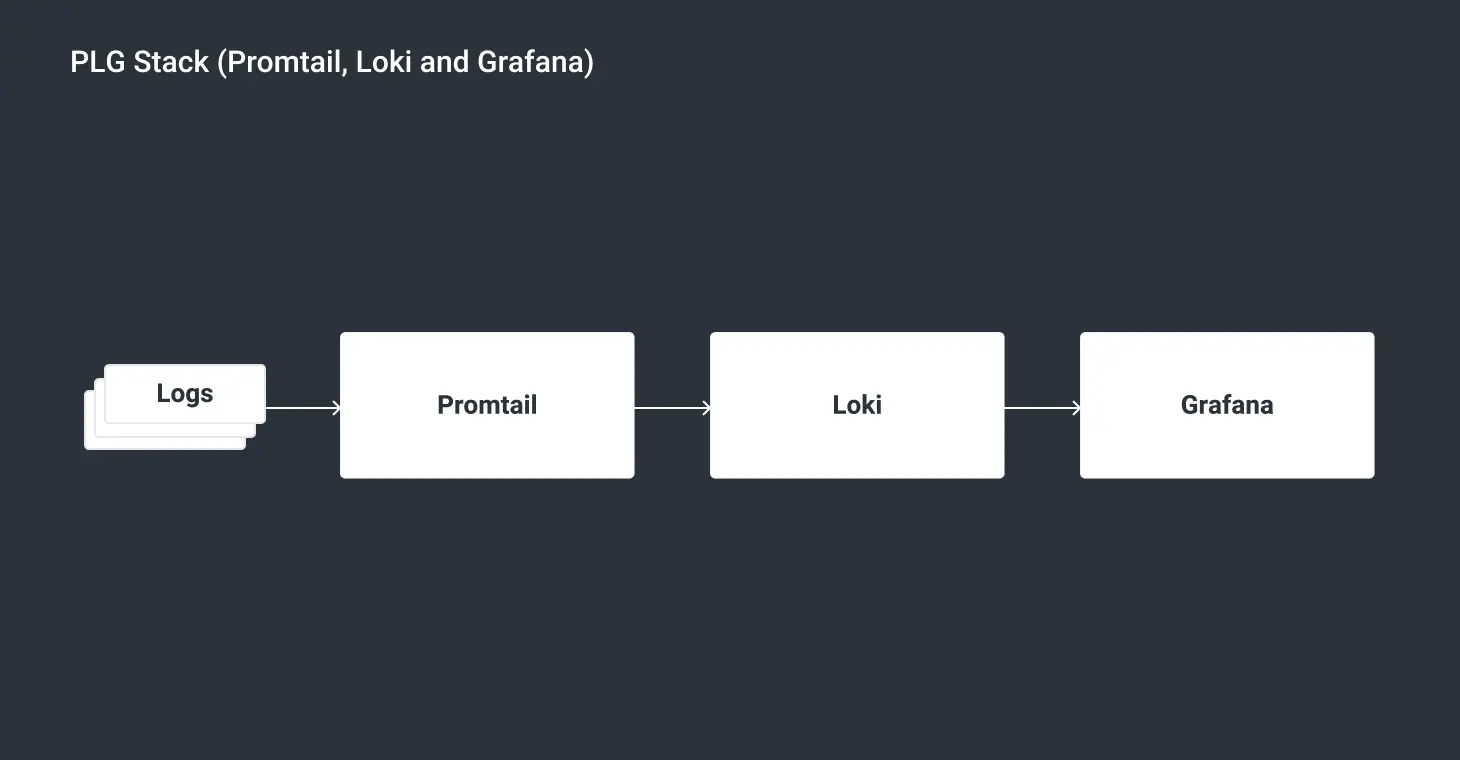
- Promtail is an agent that needs to be installed on each node running your applications or services. It detects targets (such as local log files), attaches labels to log streams from the pods, and ships them to Loki.
- Loki is the heart of the PLG Stack. It is responsible to store the log data.
- Grafana is an open-source visualization platform that processes time-series data from Loki and makes the logs accessible in a web UI.
Getting Started with the PLG Stack in Kubernetes
Let's get started with Loki with some hands-on action. In this example, we're going to use the Loki stack to visualize the logs of a Kubernetes API server in Grafana.
Before you start, make sure you have a Kubernetes cluster up and running, and Helm installed. When you're all set, we can install Loki:
Install the PLG Stack with Helm
Create a Kubernetes namespace to deploy the PLG Stack to:
$ kubectl create namespace loki
Add Loki’s Helm Chart repository:
$ helm repo add loki https://grafana.github.io/loki/charts
Run the following command to update the repository:
$ helm repo update
Deploy the Loki stack:
$ helm upgrade --install loki loki/loki-stack --namespace=loki --set grafana.enabled=true
This will install Loki, Grafana and Promtail into your Kubernetes cluster.
Retrieve the password to log into Grafana:
$ kubectl get secret loki-grafana --namespace=loki -o jsonpath="{.data.admin-password}" | base64 --decode ; echo
The generated admin password will look like this one -> jvjqUy2nhsHplVwrX8V05UgSDYEDz6pSiBZOCPHf
Finally, execute the command below to access the Grafana UI.
$ kubectl port-forward --namespace loki service/loki-grafana 3000:80
Now open your browser, and go to http://localhost:3000.
Log in with the user name "admin" and the password you retrieved previously.
Loki in Grafana
The Grafana we installed comes with the Loki data source preconfigured. So we can start right away exploring our Kubernetes logs:
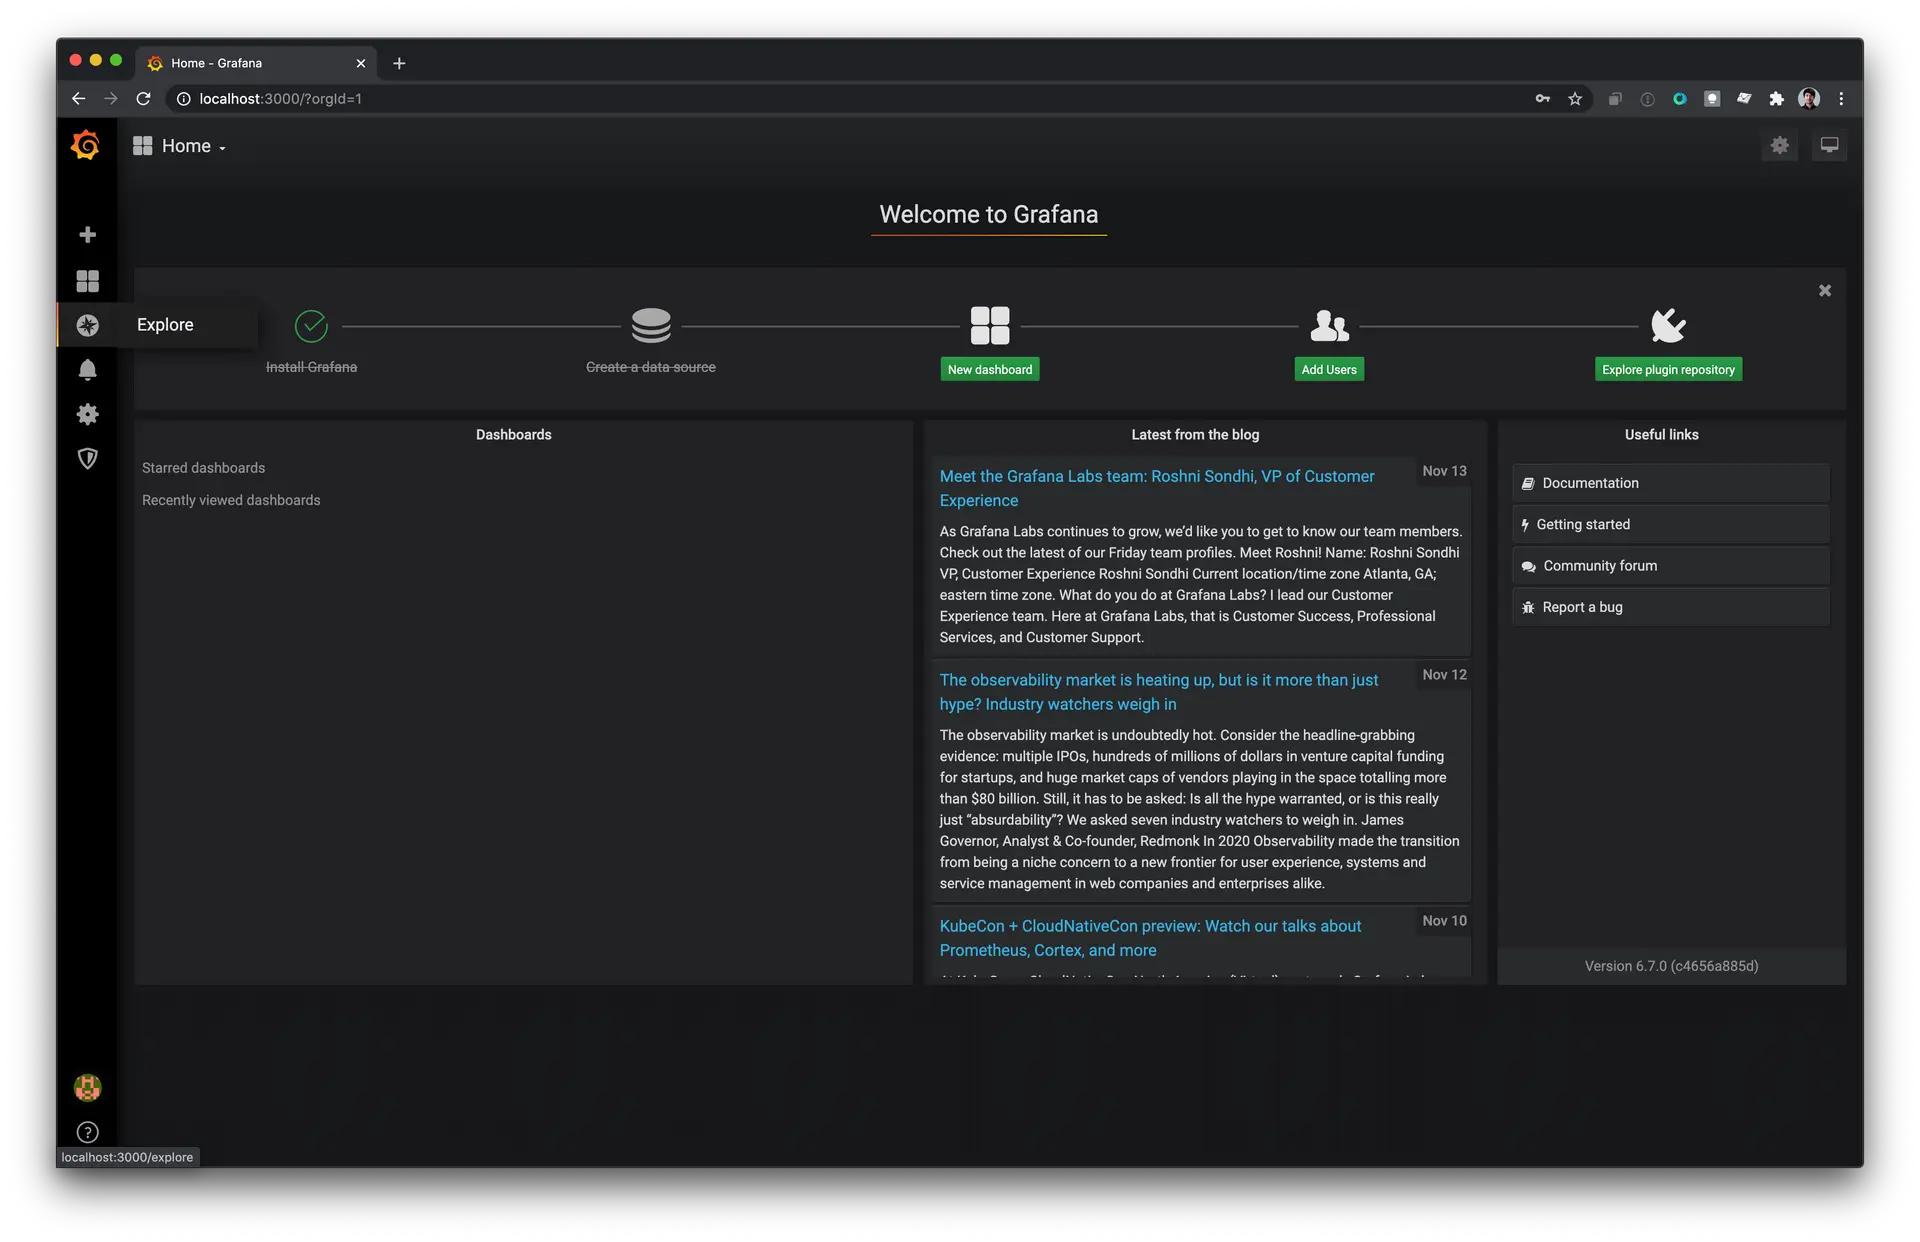
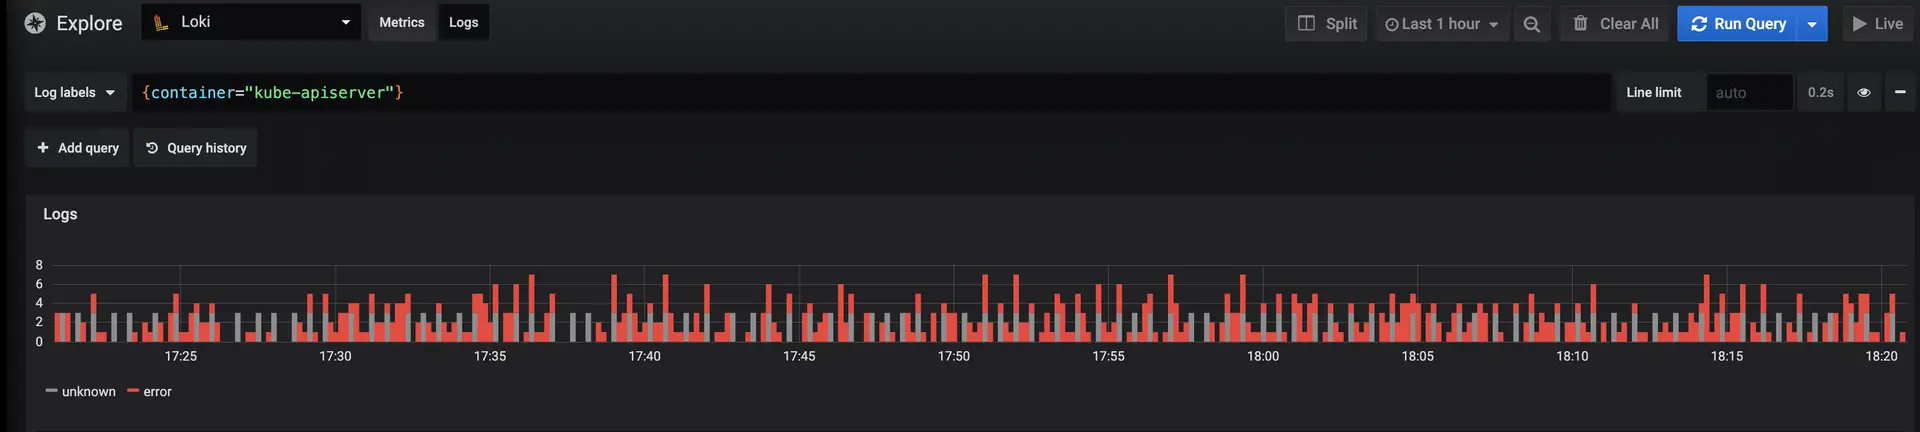
Next, click on the Explore tab on the left side. Select Loki from the data source dropdown.
Click on the Log labels dropdown > container > kube-apiserver
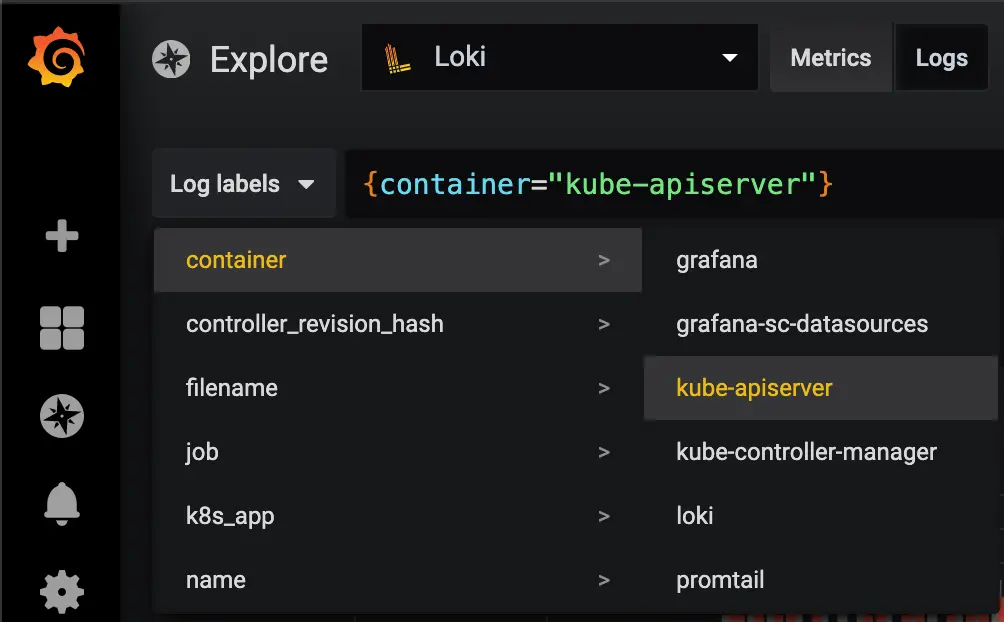
Now you should get data in the Logs window!
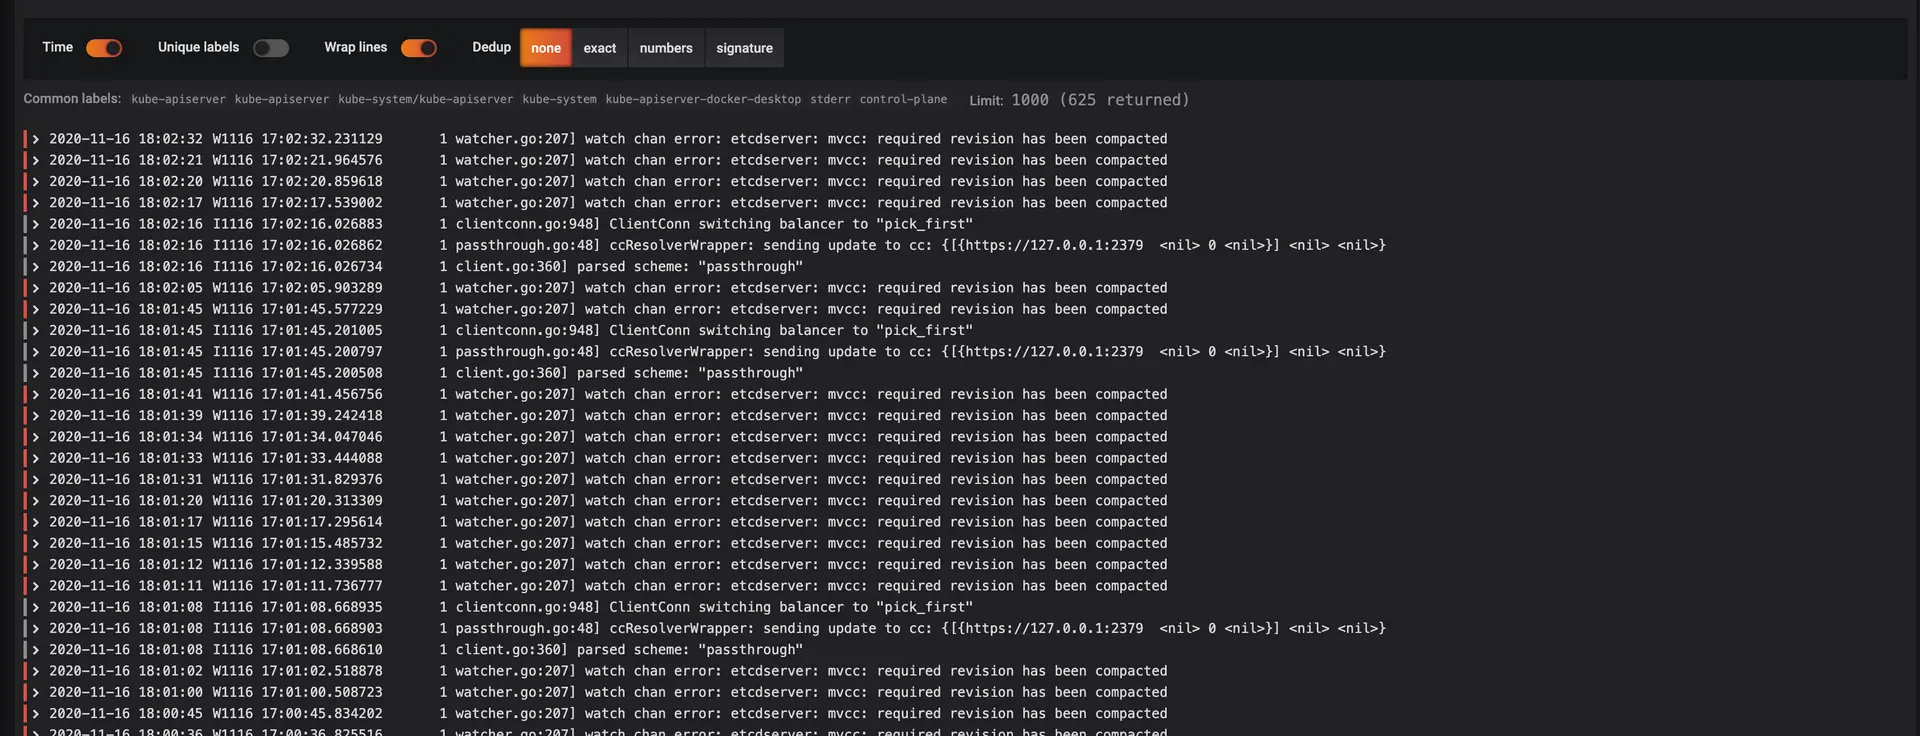
Scroll down and you will find the details on the kube-apiserver logs.
LogQL
LogQL provides the functionality to filter logs through operators. Here is a list of operators which are supported:
-
=:exactly equal. -
!=:not equal. -
=~:regex matches. -
!~:regex does not match.
Let's try it on another query. We start by searching all logs of the kube-apiserver container. In addition to that we add filter operators to limit the results to logs which include the word error, but not timeout:
{container="kube-apiserver"} |= "error" != "timeout"
This was a simple example of setting up and working with Loki and Grafana. If you want to learn more, head over to the Loki documentation.
Wrapping up
Companies need a simple and cost-effective solution to collect, store, and analyze log files from apps and services in distributed systems. Loki can help you dramatically reduce logging and monitoring costs in your production environment. In combination with Promtail and Grafana it provides all the features needed for a full logging stack which can help you find and resolve problems faster and prevent malfunctions from occurring in the future.
Would you like to learn how Loki can help you gain more insides into your software system, cut costs and strengthen DevOps in your company? Use our contact form, and we will get back to you shortly.
For our latest insights and updates, follow us on LinkedIn