Setting Up Logging within Kubernetes
Learn how to setup Elasticsearch, Fluentd and Kibana in your Kubernetes cluster.

Kentaro Wakayama
06 November 2017
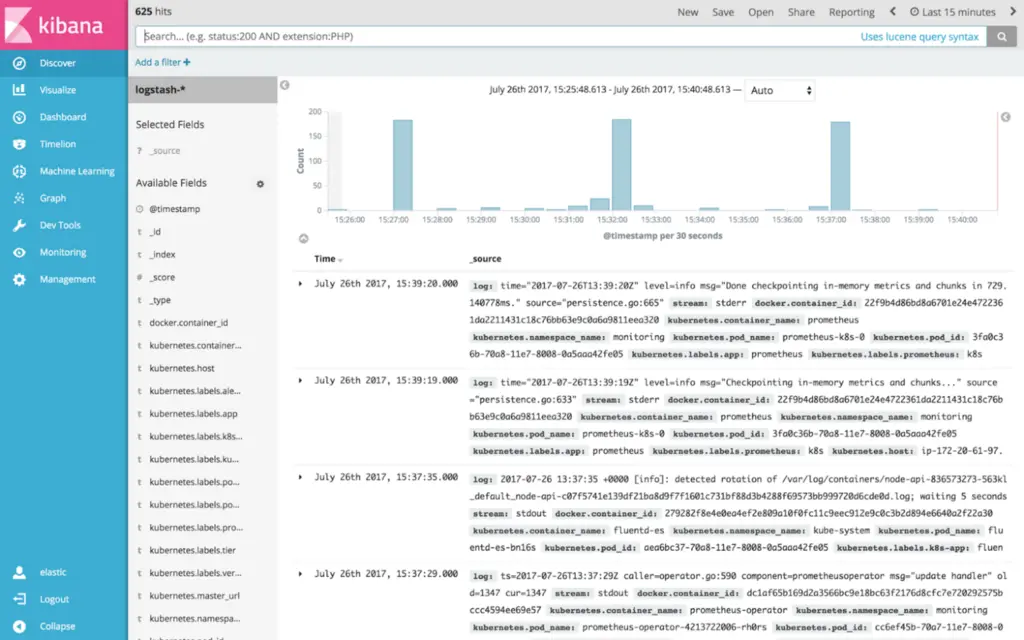
In my previous article I showed how to use the Kops tool to create a production ready Kubernetes cluster on the Amazon Web Services (AWS) cloud hosting platform. This time I will guide you in installing into this cluster the free and open source Elasticsearch search engine and its graphical counterpart Kibana, as a visual log database. This will provide you with a powerful system for storing logs from containers running in Kubernetes and navigating and searching them in an appealing graphical interface.
We will also install Fluentd as this component is responsible for transmitting the standard Kubernetes logs to Elasticsearch. These three components are together colloquially known as the EFK stack, a self explanatory acronym (an older variation on this stack is known as ELK, which is the same except that it uses Logstash instead of Fluentd).
Before going the route of maintaining your own Elasticsearch cluster, however, you might want to instead consider using the managed service from Elastic themselves, Elastic Cloud. The reason being that administrating Elasticsearch can be a lot of work, as many people experienced with the system will tell you it can be tricky to keep running smoothly and that it’s a task better outsourced to an external service (i.e. Elastic Cloud).
Official Kubernetes Add-On
Before going any further, it should be mentioned that there is a standard add-on for installing EFK in Kubernetes clusters, as part of the official Kubernetes repository. The current version of the add-on (corresponding to Elasticearch 5.6.2) is based on a contribution by yours truly to bring it up to date (5.5.1 at the time). The guide presented in this article is based on said add-on.
I will go through each part of the stack in succession, and provide the corresponding Kubernetes manifest files, and explain shortly how it functions. In order to install the logging stack in your Kubernetes cluster, apply the manifests via kubectl:
kubectl apply -f *.yaml
Elasticsearch
These manifests install Elasticsearch itself as a StatefulSet of two pods that will allocate a persistent volume of 20 GB per pod (make sure to pick a size that make sense for your workload). A Service is created in front of the StatefulSet pods to load balance them.
Elasticsearch is also configured to run under the service account elasticsearch-logging, which gets bound to the role of the same name in order for it to have the right permissions.
es-statefulset.yaml:
# RBAC authn and authz
apiVersion: v1
kind: ServiceAccount
metadata:
  name: elasticsearch-logging
  namespace: kube-system
  labels:
    k8s-app: elasticsearch-logging
    kubernetes.io/cluster-service: "true"
    addonmanager.kubernetes.io/mode: Reconcile
---
kind: ClusterRole
apiVersion: rbac.authorization.k8s.io/v1beta1
metadata:
  name: elasticsearch-logging
  labels:
    k8s-app: elasticsearch-logging
    kubernetes.io/cluster-service: "true"
    addonmanager.kubernetes.io/mode: Reconcile
rules:
- apiGroups:
  - ""
  resources:
  - "services"
  - "namespaces"
  - "endpoints"
  verbs:
  - "get"
---
kind: ClusterRoleBinding
apiVersion: rbac.authorization.k8s.io/v1beta1
metadata:
  namespace: kube-system
  name: elasticsearch-logging
  labels:
    k8s-app: elasticsearch-logging
    kubernetes.io/cluster-service: "true"
    addonmanager.kubernetes.io/mode: Reconcile
subjects:
- kind: ServiceAccount
  name: elasticsearch-logging
  namespace: kube-system
  apiGroup: ""
roleRef:
  kind: ClusterRole
  name: elasticsearch-logging
  apiGroup: ""
---
# Elasticsearch deployment itself
apiVersion: apps/v1beta1
kind: StatefulSet
metadata:
  name: elasticsearch-logging
  namespace: kube-system
  labels:
    k8s-app: elasticsearch-logging
    version: v5.6.2
    kubernetes.io/cluster-service: "true"
    addonmanager.kubernetes.io/mode: Reconcile
spec:
  serviceName: elasticsearch-logging
  replicas: 2
  selector:
    matchLabels:
      k8s-app: elasticsearch-logging
      version: v5.6.2
  template:
    metadata:
      labels:
        k8s-app: elasticsearch-logging
        version: v5.6.2
        kubernetes.io/cluster-service: "true"
    spec:
      serviceAccountName: elasticsearch-logging
      containers:
      - image: gcr.io/google-containers/elasticsearch:v5.6.2
        name: elasticsearch-logging
        resources:
          # need more cpu upon initialization, therefore burstable class
          limits:
            cpu: 1000m
          requests:
            cpu: 100m
        ports:
        - containerPort: 9200
          name: db
          protocol: TCP
        - containerPort: 9300
          name: transport
          protocol: TCP
        volumeMounts:
        - name: elasticsearch-logging
          mountPath: /data
        env:
        - name: "NAMESPACE"
          valueFrom:
            fieldRef:
              fieldPath: metadata.namespace
      initContainers:
      - image: alpine:3.6
        command: ["/sbin/sysctl", "-w", "vm.max_map_count=262144"]
        name: elasticsearch-logging-init
        securityContext:
          privileged: true
  volumeClaimTemplates:
  - metadata:
      name: elasticsearch-logging
    spec:
      accessModes: ["ReadWriteOnce"]
      resources:
        requests:
          storage: 20Gi
es-service.yaml:
apiVersion: v1
kind: Service
metadata:
  name: elasticsearch-logging
  namespace: kube-system
  labels:
    k8s-app: elasticsearch-logging
    kubernetes.io/cluster-service: "true"
    addonmanager.kubernetes.io/mode: Reconcile
    kubernetes.io/name: "Elasticsearch"
spec:
  ports:
  - port: 9200
    protocol: TCP
    targetPort: db
  selector:
    k8s-app: elasticsearch-logging
Elasticsearch Curator
Alongside Elasticsearch itself we deploy a service called Elasticsearch Curator, which does automatic maintenance of your Elasticsearch cluster. In our case we make it delete indices older than three days. If you want to tweak this configuration, Base64 decode the values for action_file.yaml and/or config.yaml in es-curator-secret.yaml (Kubernetes requires secret values to be Base64 encoded), make your changes and re-insert the Base64 encoded contents of respective files.
es-curator.yaml:
apiVersion: apps/v1beta1
kind: Deployment
metadata:
  name: es-curator
  namespace: kube-system
  labels:
    k8s-app: es-curator
spec:
  replicas: 1
  selector:
    matchLabels:
      k8s-app: es-curator
  template:
    metadata:
      labels:
        k8s-app: es-curator
    spec:
      containers:
      - name: es-curator
        image: aknudsen/es-curator-service:5.3.0-1
        imagePullPolicy: IfNotPresent
        args: ["--config", "/etc/config/config.yml", "/etc/config/action_file.yml"]
        volumeMounts:
          - name: config-volume
            mountPath: /etc/config
      volumes:
        - name: config-volume
          secret:
            secretName: curator-config
es-curator-secret.yaml:
apiVersion: v1
kind: Secret
metadata:
  name: curator-config
  namespace: kube-system
type: Opaque
data:
  action_file.yml: YWN0aW9uczoKICAxOgogICAgYWN0aW9uOiBkZWxldGVfaW5kaWNlcwogICAgZGVzY3JpcHRpb246ICJDbGVhbiB1cCBFUyBieSBkZWxldGluZyBvbGQgaW5kaWNlcyIKICAgIG9wdGlvbnM6CiAgICAgIGlnbm9yZV9lbXB0eV9saXN0OiBUcnVlCiAgICAgIHRpbWVvdXRfb3ZlcnJpZGU6CiAgICAgIGNvbnRpbnVlX2lmX2V4Y2VwdGlvbjogRmFsc2UKICAgICAgZGlzYWJsZV9hY3Rpb246IEZhbHNlCiAgICBmaWx0ZXJzOgogICAgLSBmaWx0ZXJ0eXBlOiBhZ2UKICAgICAgc291cmNlOiBuYW1lCiAgICAgIGRpcmVjdGlvbjogb2xkZXIKICAgICAgdGltZXN0cmluZzogJyVZLiVtLiVkJwogICAgICB1bml0OiBkYXlzCiAgICAgIHVuaXRfY291bnQ6IDMKICAgICAgZmllbGQ6CiAgICAgIHN0YXRzX3Jlc3VsdDoKICAgICAgZXBvY2g6CiAgICAgIGV4Y2x1ZGU6IEZhbHNlCg==
  config.yml: Y2xpZW50OgogIGhvc3RzOgogICAgLSBlbGFzdGljc2VhcmNoLWxvZ2dpbmcKICBwb3J0OiA5MjAwCiAgdXJsX3ByZWZpeDoKICB1c2Vfc3NsOiBGYWxzZQogIGNlcnRpZmljYXRlOgogIGNsaWVudF9jZXJ0OgogIGNsaWVudF9rZXk6CiAgc3NsX25vX3ZhbGlkYXRlOiBGYWxzZQogIGh0dHBfYXV0aDogZWxhc3RpYzpjaGFuZ2VtZQogIHRpbWVvdXQ6IDMwCiAgbWFzdGVyX29ubHk6IEZhbHNlCmxvZ2dpbmc6CiAgbG9nbGV2ZWw6IElORk8KICBsb2dmaWxlOgogIGxvZ2Zvcm1hdDogZGVmYXVsdAogIGJsYWNrbGlzdDogWydlbGFzdGljc2VhcmNoJywgJ3VybGxpYjMnXQo=
Fluentd
Fluentd is installed as a DaemonSet, which means that a corresponding pod will run on every Kubernetes worker node in order to collect its logs (and send them to Elasticsearch). Furthermore, the pods run as the service account fluentd-es which is bound to the cluster role with the same name in order to have the necessary permissions.
fluentd-es-configmap.yaml:
kind: ConfigMap
apiVersion: v1
data:
  containers.input.conf: |-
    # This configuration file for Fluentd / td-agent is used
    # to watch changes to Docker log files. The kubelet creates symlinks that
    # capture the pod name, namespace, container name & Docker container ID
    # to the docker logs for pods in the /var/log/containers directory on the host.
    # If running this fluentd configuration in a Docker container, the /var/log
    # directory should be mounted in the container.
    #
    # These logs are then submitted to Elasticsearch which assumes the
    # installation of the fluent-plugin-elasticsearch & the
    # fluent-plugin-kubernetes_metadata_filter plugins.
    # See https://github.com/uken/fluent-plugin-elasticsearch &
    # https://github.com/fabric8io/fluent-plugin-kubernetes_metadata_filter for
    # more information about the plugins.
    #
    # Example
    # =======
    # A line in the Docker log file might look like this JSON:
    #
    # {"log":"2014/09/25 21:15:03 Got request with path wombat\n",
    #  "stream":"stderr",
    #   "time":"2014-09-25T21:15:03.499185026Z"}
    #
    # The time_format specification below makes sure we properly
    # parse the time format produced by Docker. This will be
    # submitted to Elasticsearch and should appear like:
    # $ curl 'http://elasticsearch-logging:9200/_search?pretty'
    # ...
    # {
    #      "_index" : "logstash-2014.09.25",
    #      "_type" : "fluentd",
    #      "_id" : "VBrbor2QTuGpsQyTCdfzqA",
    #      "_score" : 1.0,
    #      "_source":{"log":"2014/09/25 22:45:50 Got request with path wombat\n",
    #                 "stream":"stderr","tag":"docker.container.all",
    #                 "@timestamp":"2014-09-25T22:45:50+00:00"}
    #    },
    # ...
    #
    # The Kubernetes fluentd plugin is used to write the Kubernetes metadata to the log
    # record & add labels to the log record if properly configured. This enables users
    # to filter & search logs on any metadata.
    # For example a Docker container's logs might be in the directory:
    #
    #  /var/lib/docker/containers/997599971ee6366d4a5920d25b79286ad45ff37a74494f262e3bc98d909d0a7b
    #
    # and in the file:
    #
    #  997599971ee6366d4a5920d25b79286ad45ff37a74494f262e3bc98d909d0a7b-json.log
    #
    # where 997599971ee6... is the Docker ID of the running container.
    # The Kubernetes kubelet makes a symbolic link to this file on the host machine
    # in the /var/log/containers directory which includes the pod name and the Kubernetes
    # container name:
    #
    #    synthetic-logger-0.25lps-pod_default_synth-lgr-997599971ee6366d4a5920d25b79286ad45ff37a74494f262e3bc98d909d0a7b.log
    #    ->
    #    /var/lib/docker/containers/997599971ee6366d4a5920d25b79286ad45ff37a74494f262e3bc98d909d0a7b/997599971ee6366d4a5920d25b79286ad45ff37a74494f262e3bc98d909d0a7b-json.log
    #
    # The /var/log directory on the host is mapped to the /var/log directory in the container
    # running this instance of Fluentd and we end up collecting the file:
    #
    #   /var/log/containers/synthetic-logger-0.25lps-pod_default_synth-lgr-997599971ee6366d4a5920d25b79286ad45ff37a74494f262e3bc98d909d0a7b.log
    #
    # This results in the tag:
    #
    #  var.log.containers.synthetic-logger-0.25lps-pod_default_synth-lgr-997599971ee6366d4a5920d25b79286ad45ff37a74494f262e3bc98d909d0a7b.log
    #
    # The Kubernetes fluentd plugin is used to extract the namespace, pod name & container name
    # which are added to the log message as a kubernetes field object & the Docker container ID
    # is also added under the docker field object.
    # The final tag is:
    #
    #   kubernetes.var.log.containers.synthetic-logger-0.25lps-pod_default_synth-lgr-997599971ee6366d4a5920d25b79286ad45ff37a74494f262e3bc98d909d0a7b.log
    #
    # And the final log record look like:
    #
    # {
    #   "log":"2014/09/25 21:15:03 Got request with path wombat\n",
    #   "stream":"stderr",
    #   "time":"2014-09-25T21:15:03.499185026Z",
    #   "kubernetes": {
    #     "namespace": "default",
    #     "pod_name": "synthetic-logger-0.25lps-pod",
    #     "container_name": "synth-lgr"
    #   },
    #   "docker": {
    #     "container_id": "997599971ee6366d4a5920d25b79286ad45ff37a74494f262e3bc98d909d0a7b"
    #   }
    # }
    #
    # This makes it easier for users to search for logs by pod name or by
    # the name of the Kubernetes container regardless of how many times the
    # Kubernetes pod has been restarted (resulting in a several Docker container IDs).

    # Example:
    # {"log":"[info:2016-02-16T16:04:05.930-08:00] Some log text here\n","stream":"stdout","time":"2016-02-17T00:04:05.931087621Z"}
    <source>
      type tail
      path /var/log/containers/*.log
      pos_file /var/log/es-containers.log.pos
      time_format %Y-%m-%dT%H:%M:%S.%NZ
      tag kubernetes.*
      format json
      read_from_head true
    </source>
  system.input.conf: |-
    # Example:
    # 2015-12-21 23:17:22,066 [salt.state       ][INFO    ] Completed state [net.ipv4.ip_forward] at time 23:17:22.066081
    <source>
      type tail
      format /^(?<time>[^ ]* [^ ,]*)[^\[]*\[[^\]]*\]\[(?<severity>[^ \]]*) *\] (?<message>.*)$/
      time_format %Y-%m-%d %H:%M:%S
      path /var/log/salt/minion
      pos_file /var/log/es-salt.pos
      tag salt
    </source>

    # Example:
    # Dec 21 23:17:22 gke-foo-1-1-4b5cbd14-node-4eoj startupscript: Finished running startup script /var/run/google.startup.script
    <source>
      type tail
      format syslog
      path /var/log/startupscript.log
      pos_file /var/log/es-startupscript.log.pos
      tag startupscript
    </source>

    # Examples:
    # time="2016-02-04T06:51:03.053580605Z" level=info msg="GET /containers/json"
    # time="2016-02-04T07:53:57.505612354Z" level=error msg="HTTP Error" err="No such image: -f" statusCode=404
    <source>
      type tail
      format /^time="(?<time>[^)]*)" level=(?<severity>[^ ]*) msg="(?<message>[^"]*)"( err="(?<error>[^"]*)")?( statusCode=($<status_code>\d+))?/
      path /var/log/docker.log
      pos_file /var/log/es-docker.log.pos
      tag docker
    </source>

    # Example:
    # 2016/02/04 06:52:38 filePurge: successfully removed file /var/etcd/data/member/wal/00000000000006d0-00000000010a23d1.wal
    <source>
      type tail
      # Not parsing this, because it doesn't have anything particularly useful to
      # parse out of it (like severities).
      format none
      path /var/log/etcd.log
      pos_file /var/log/es-etcd.log.pos
      tag etcd
    </source>

    # Multi-line parsing is required for all the kube logs because very large log
    # statements, such as those that include entire object bodies, get split into
    # multiple lines by glog.

    # Example:
    # I0204 07:32:30.020537    3368 server.go:1048] POST /stats/container/: (13.972191ms) 200 [[Go-http-client/1.1] 10.244.1.3:40537]
    <source>
      type tail
      format multiline
      multiline_flush_interval 5s
      format_firstline /^\w\d{4}/
      format1 /^(?<severity>\w)(?<time>\d{4} [^\s]*)\s+(?<pid>\d+)\s+(?<source>[^ \]]+)\] (?<message>.*)/
      time_format %m%d %H:%M:%S.%N
      path /var/log/kubelet.log
      pos_file /var/log/es-kubelet.log.pos
      tag kubelet
    </source>

    # Example:
    # I1118 21:26:53.975789       6 proxier.go:1096] Port "nodePort for kube-system/default-http-backend:http" (:31429/tcp) was open before and is still needed
    <source>
      type tail
      format multiline
      multiline_flush_interval 5s
      format_firstline /^\w\d{4}/
      format1 /^(?<severity>\w)(?<time>\d{4} [^\s]*)\s+(?<pid>\d+)\s+(?<source>[^ \]]+)\] (?<message>.*)/
      time_format %m%d %H:%M:%S.%N
      path /var/log/kube-proxy.log
      pos_file /var/log/es-kube-proxy.log.pos
      tag kube-proxy
    </source>

    # Example:
    # I0204 07:00:19.604280       5 handlers.go:131] GET /api/v1/nodes: (1.624207ms) 200 [[kube-controller-manager/v1.1.3 (linux/amd64) kubernetes/6a81b50] 127.0.0.1:38266]
    <source>
      type tail
      format multiline
      multiline_flush_interval 5s
      format_firstline /^\w\d{4}/
      format1 /^(?<severity>\w)(?<time>\d{4} [^\s]*)\s+(?<pid>\d+)\s+(?<source>[^ \]]+)\] (?<message>.*)/
      time_format %m%d %H:%M:%S.%N
      path /var/log/kube-apiserver.log
      pos_file /var/log/es-kube-apiserver.log.pos
      tag kube-apiserver
    </source>

    # Example:
    # I0204 06:55:31.872680       5 servicecontroller.go:277] LB already exists and doesn't need update for service kube-system/kube-ui
    <source>
      type tail
      format multiline
      multiline_flush_interval 5s
      format_firstline /^\w\d{4}/
      format1 /^(?<severity>\w)(?<time>\d{4} [^\s]*)\s+(?<pid>\d+)\s+(?<source>[^ \]]+)\] (?<message>.*)/
      time_format %m%d %H:%M:%S.%N
      path /var/log/kube-controller-manager.log
      pos_file /var/log/es-kube-controller-manager.log.pos
      tag kube-controller-manager
    </source>

    # Example:
    # W0204 06:49:18.239674       7 reflector.go:245] pkg/scheduler/factory/factory.go:193: watch of *api.Service ended with: 401: The event in requested index is outdated and cleared (the requested history has been cleared [2578313/2577886]) [2579312]
    <source>
      type tail
      format multiline
      multiline_flush_interval 5s
      format_firstline /^\w\d{4}/
      format1 /^(?<severity>\w)(?<time>\d{4} [^\s]*)\s+(?<pid>\d+)\s+(?<source>[^ \]]+)\] (?<message>.*)/
      time_format %m%d %H:%M:%S.%N
      path /var/log/kube-scheduler.log
      pos_file /var/log/es-kube-scheduler.log.pos
      tag kube-scheduler
    </source>

    # Example:
    # I1104 10:36:20.242766       5 rescheduler.go:73] Running Rescheduler
    <source>
      type tail
      format multiline
      multiline_flush_interval 5s
      format_firstline /^\w\d{4}/
      format1 /^(?<severity>\w)(?<time>\d{4} [^\s]*)\s+(?<pid>\d+)\s+(?<source>[^ \]]+)\] (?<message>.*)/
      time_format %m%d %H:%M:%S.%N
      path /var/log/rescheduler.log
      pos_file /var/log/es-rescheduler.log.pos
      tag rescheduler
    </source>

    # Example:
    # I0603 15:31:05.793605       6 cluster_manager.go:230] Reading config from path /etc/gce.conf
    <source>
      type tail
      format multiline
      multiline_flush_interval 5s
      format_firstline /^\w\d{4}/
      format1 /^(?<severity>\w)(?<time>\d{4} [^\s]*)\s+(?<pid>\d+)\s+(?<source>[^ \]]+)\] (?<message>.*)/
      time_format %m%d %H:%M:%S.%N
      path /var/log/glbc.log
      pos_file /var/log/es-glbc.log.pos
      tag glbc
    </source>

    # Example:
    # I0603 15:31:05.793605       6 cluster_manager.go:230] Reading config from path /etc/gce.conf
    <source>
      type tail
      format multiline
      multiline_flush_interval 5s
      format_firstline /^\w\d{4}/
      format1 /^(?<severity>\w)(?<time>\d{4} [^\s]*)\s+(?<pid>\d+)\s+(?<source>[^ \]]+)\] (?<message>.*)/
      time_format %m%d %H:%M:%S.%N
      path /var/log/cluster-autoscaler.log
      pos_file /var/log/es-cluster-autoscaler.log.pos
      tag cluster-autoscaler
    </source>

    # Logs from systemd-journal for interesting services.
    <source>
      type systemd
      filters [{ "_SYSTEMD_UNIT": "docker.service" }]
      pos_file /var/log/gcp-journald-docker.pos
      read_from_head true
      tag docker
    </source>

    <source>
      type systemd
      filters [{ "_SYSTEMD_UNIT": "kubelet.service" }]
      pos_file /var/log/gcp-journald-kubelet.pos
      read_from_head true
      tag kubelet
    </source>

    <source>
      type systemd
      filters [{ "_SYSTEMD_UNIT": "node-problem-detector.service" }]
      pos_file /var/log/gcp-journald-node-problem-detector.pos
      read_from_head true
      tag node-problem-detector
    </source>
  forward.input.conf: |-
    # Takes the messages sent over TCP
    <source>
      type forward
    </source>
  monitoring.conf: |-
    # Prometheus Exporter Plugin
    # input plugin that exports metrics
    <source>
      @type prometheus
    </source>

    <source>
      @type monitor_agent
    </source>

    # input plugin that collects metrics from MonitorAgent
    <source>
      @type prometheus_monitor
      <labels>
        host ${hostname}
      </labels>
    </source>

    # input plugin that collects metrics for output plugin
    <source>
      @type prometheus_output_monitor
      <labels>
        host ${hostname}
      </labels>
    </source>

    # input plugin that collects metrics for in_tail plugin
    <source>
      @type prometheus_tail_monitor
      <labels>
        host ${hostname}
      </labels>
    </source>
  output.conf: |-
    # Enriches records with Kubernetes metadata
    <filter kubernetes.**>
      type kubernetes_metadata
    </filter>

    <match **>
       type elasticsearch
       log_level info
       include_tag_key true
       host elasticsearch-logging
       port 9200
       logstash_format true
       # Set the chunk limits.
       buffer_chunk_limit 2M
       buffer_queue_limit 8
       flush_interval 5s
       # Never wait longer than 5 minutes between retries.
       max_retry_wait 30
       # Disable the limit on the number of retries (retry forever).
       disable_retry_limit
       # Use multiple threads for processing.
       num_threads 2
    </match>
metadata:
  name: fluentd-es-config-v0.1.0
  namespace: kube-system
  labels:
    addonmanager.kubernetes.io/mode: Reconcile
fluentd-es-ds.yaml:
apiVersion: v1
kind: ServiceAccount
metadata:
  name: fluentd-es
  namespace: kube-system
  labels:
    k8s-app: fluentd-es
    kubernetes.io/cluster-service: "true"
    addonmanager.kubernetes.io/mode: Reconcile
---
kind: ClusterRole
apiVersion: rbac.authorization.k8s.io/v1beta1
metadata:
  name: fluentd-es
  labels:
    k8s-app: fluentd-es
    kubernetes.io/cluster-service: "true"
    addonmanager.kubernetes.io/mode: Reconcile
rules:
- apiGroups:
  - ""
  resources:
  - "namespaces"
  - "pods"
  verbs:
  - "get"
  - "watch"
  - "list"
---
kind: ClusterRoleBinding
apiVersion: rbac.authorization.k8s.io/v1beta1
metadata:
  name: fluentd-es
  labels:
    k8s-app: fluentd-es
    kubernetes.io/cluster-service: "true"
    addonmanager.kubernetes.io/mode: Reconcile
subjects:
- kind: ServiceAccount
  name: fluentd-es
  namespace: kube-system
  apiGroup: ""
roleRef:
  kind: ClusterRole
  name: fluentd-es
  apiGroup: ""
---
apiVersion: apps/v1beta1
kind: DaemonSet
metadata:
  name: fluentd-es-v2.0.2
  namespace: kube-system
  labels:
    k8s-app: fluentd-es
    version: v2.0.2
    kubernetes.io/cluster-service: "true"
    addonmanager.kubernetes.io/mode: Reconcile
spec:
  template:
    metadata:
      labels:
        k8s-app: fluentd-es
        kubernetes.io/cluster-service: "true"
        version: v2.0.2
      # This annotation ensures that fluentd does not get evicted if the node
      # supports critical pod annotation based priority scheme.
      # Note that this does not guarantee admission on the nodes (#40573).
      annotations:
        scheduler.alpha.kubernetes.io/critical-pod: ''
    spec:
      serviceAccountName: fluentd-es
      containers:
      - name: fluentd-es
        image: gcr.io/google-containers/fluentd-elasticsearch:v2.0.2
        env:
        - name: FLUENTD_ARGS
          value: --no-supervisor -q
        resources:
          limits:
            memory: 500Mi
          requests:
            cpu: 100m
            memory: 200Mi
        volumeMounts:
        - name: varlog
          mountPath: /var/log
        - name: varlibdockercontainers
          mountPath: /var/lib/docker/containers
          readOnly: true
        - name: libsystemddir
          mountPath: /host/lib
          readOnly: true
        - name: config-volume
          mountPath: /etc/fluent/config.d
      nodeSelector:
        beta.kubernetes.io/fluentd-ds-ready: "true"
      terminationGracePeriodSeconds: 30
      volumes:
      - name: varlog
        hostPath:
          path: /var/log
      - name: varlibdockercontainers
        hostPath:
          path: /var/lib/docker/containers
      # It is needed to copy systemd library to decompress journals
      - name: libsystemddir
        hostPath:
          path: /usr/lib64
      - name: config-volume
        configMap:
          name: fluentd-es-config-v0.1.0
Kibana
There’s not much to say about the Kibana manifests; we install a Deployment, which ensures that one pod is always running, and a Service in front of it (which is capable of load balancing in case there should be several pods in parallel).
kibana-deployment.yaml:
apiVersion: apps/v1beta1
kind: Deployment
metadata:
  name: kibana-logging
  namespace: kube-system
  labels:
    k8s-app: kibana-logging
    kubernetes.io/cluster-service: "true"
    addonmanager.kubernetes.io/mode: Reconcile
spec:
  replicas: 1
  selector:
    matchLabels:
      k8s-app: kibana-logging
  template:
    metadata:
      labels:
        k8s-app: kibana-logging
    spec:
      containers:
      - name: kibana-logging
        image: docker.elastic.co/kibana/kibana:5.6.2
        resources:
          # need more cpu upon initialization, therefore burstable class
          limits:
            cpu: 1000m
          requests:
            cpu: 100m
        env:
          - name: ELASTICSEARCH_URL
            value: [http://elasticsearch-logging:9200](http://elasticsearch-logging:9200)
          - name: SERVER_BASEPATH
            value: /api/v1/proxy/namespaces/kube-system/services/kibana-logging
          - name: XPACK_MONITORING_ENABLED
            value: "false"
          - name: XPACK_SECURITY_ENABLED
            value: "false"
        ports:
        - containerPort: 5601
          name: ui
          protocol: TCP
kibana-service.yaml
apiVersion: v1
kind: Service
metadata:
  name: kibana-logging
  namespace: kube-system
  labels:
    k8s-app: kibana-logging
    kubernetes.io/cluster-service: "true"
    addonmanager.kubernetes.io/mode: Reconcile
    kubernetes.io/name: "Kibana"
spec:
  ports:
  - port: 5601
    protocol: TCP
    targetPort: ui
  selector:
    k8s-app: kibana-logging
Scripted Setup
As described in the previous article in this series, we have made a Python script to create a Kubernetes cluster on AWS with the help of the kops tool. This script also installs the EFK stack within the cluster (in addition to Prometheus Operator for monitoring), so you might give it a spin if you are creating your Kubernetes clusters from scratch on AWS or you could simply use its EFK manifests to integrate with your own cluster(s).
In future articles we will detail installation of the Prometheus Operator monitoring stack plus other Kubernetes practices that we make use of at Coder Society. Stay posted!
For our latest insights and updates, follow us on LinkedIn